
How to design clear fiscal arrangements, increase local revenue and strengthen local financial capacity.
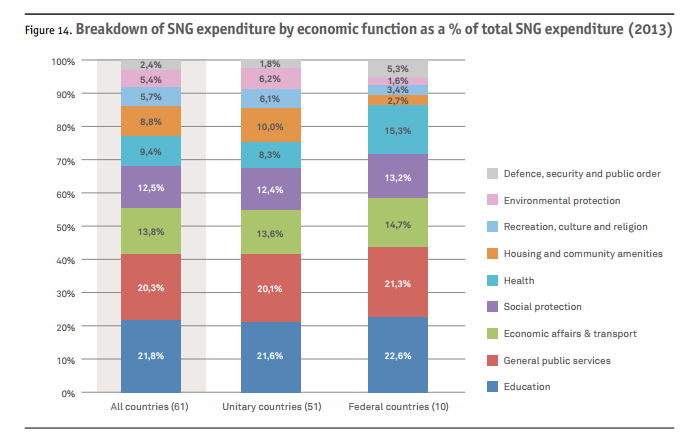
Recent research by the OECD and UCLG in 101 countries shows that the biggest share of regional and local government budgets (22%) goes to education. It also concludes that the main sources of income are national grants and subsidies (over 52%).

After education follow expenditures on general public services such as local staff, organisational and operational costs (20%) and costs for economic affairs and transportation (14%). Social services, benefits and safety nets make up 13% of the expenditures. 9% is spent on health as well as on housing and public services (a.o. water supply, public lighting). 5,5 % goes to recreation, culture and religion, for example, sports, libraries and museums, and a similar percentage is spent on environmental protection, such as waste, sewerage, nature, air, parks, water treatment. Finally, according to the report, 2,5% is reserved for security and public order (police, fire protection, emergency services, prisons, civil protection).
“On average, local and regional governments account for around 25% of total government spending.”
Income resources
Grants and subsidies from higher levels of government account for over 52% of the revenues of subnational governments. This also includes international aid and EU-funds. Taxes – both shared and local taxes – make up 32% of the local income. The remaining 16% consists of other financial resources: user fees for public services such as water and sanitation, waste collection, cultural services, sports and public transport; social contributions and property income (e.g. sale of physical and financial assets, dividends from local companies or royalties).
These figures underline that most subnational governments for the execution of their tasks are still very much dependent on the central government. Moreover, the report shows that there are clear differences in the financial position of local authorities in low, middle and high-income countries. In low-income countries, local income makes up only 8% of the total public revenue, while in lower middle-income countries this is 21%, in higher middle-income countries 24% and in high-income countries even 31%.
Scope of the study
The research was done amongst 500.000 subnational governments, of which half 250,706 in India. The average size was 56,000 inhabitants. Included were both unitary and federal states, of which the latter account for the largest shares of subnational income and expenditures. The 101 countries that were studied represent high-income (37%), middle-income (50%) and low income (14%) economies in all parts of the world and account for 82% of the world’s population.
Learn more
Do you want to learn more about central-local government fiscal relations, local government spending, increasing local revenues and participatory methods for budgeting? There are still a few places available in our Fiscal Decentralisation & Local Finance course that takes place from 12 to 23 February 2018.
Related courses
We offer a diversity of courses throughout the year. Here are several other courses you might like.